The Distilled · Order Flow + Reversal Continuation Sequence
Six timeframes, one read: where the turn is, whether it held, where it's going.
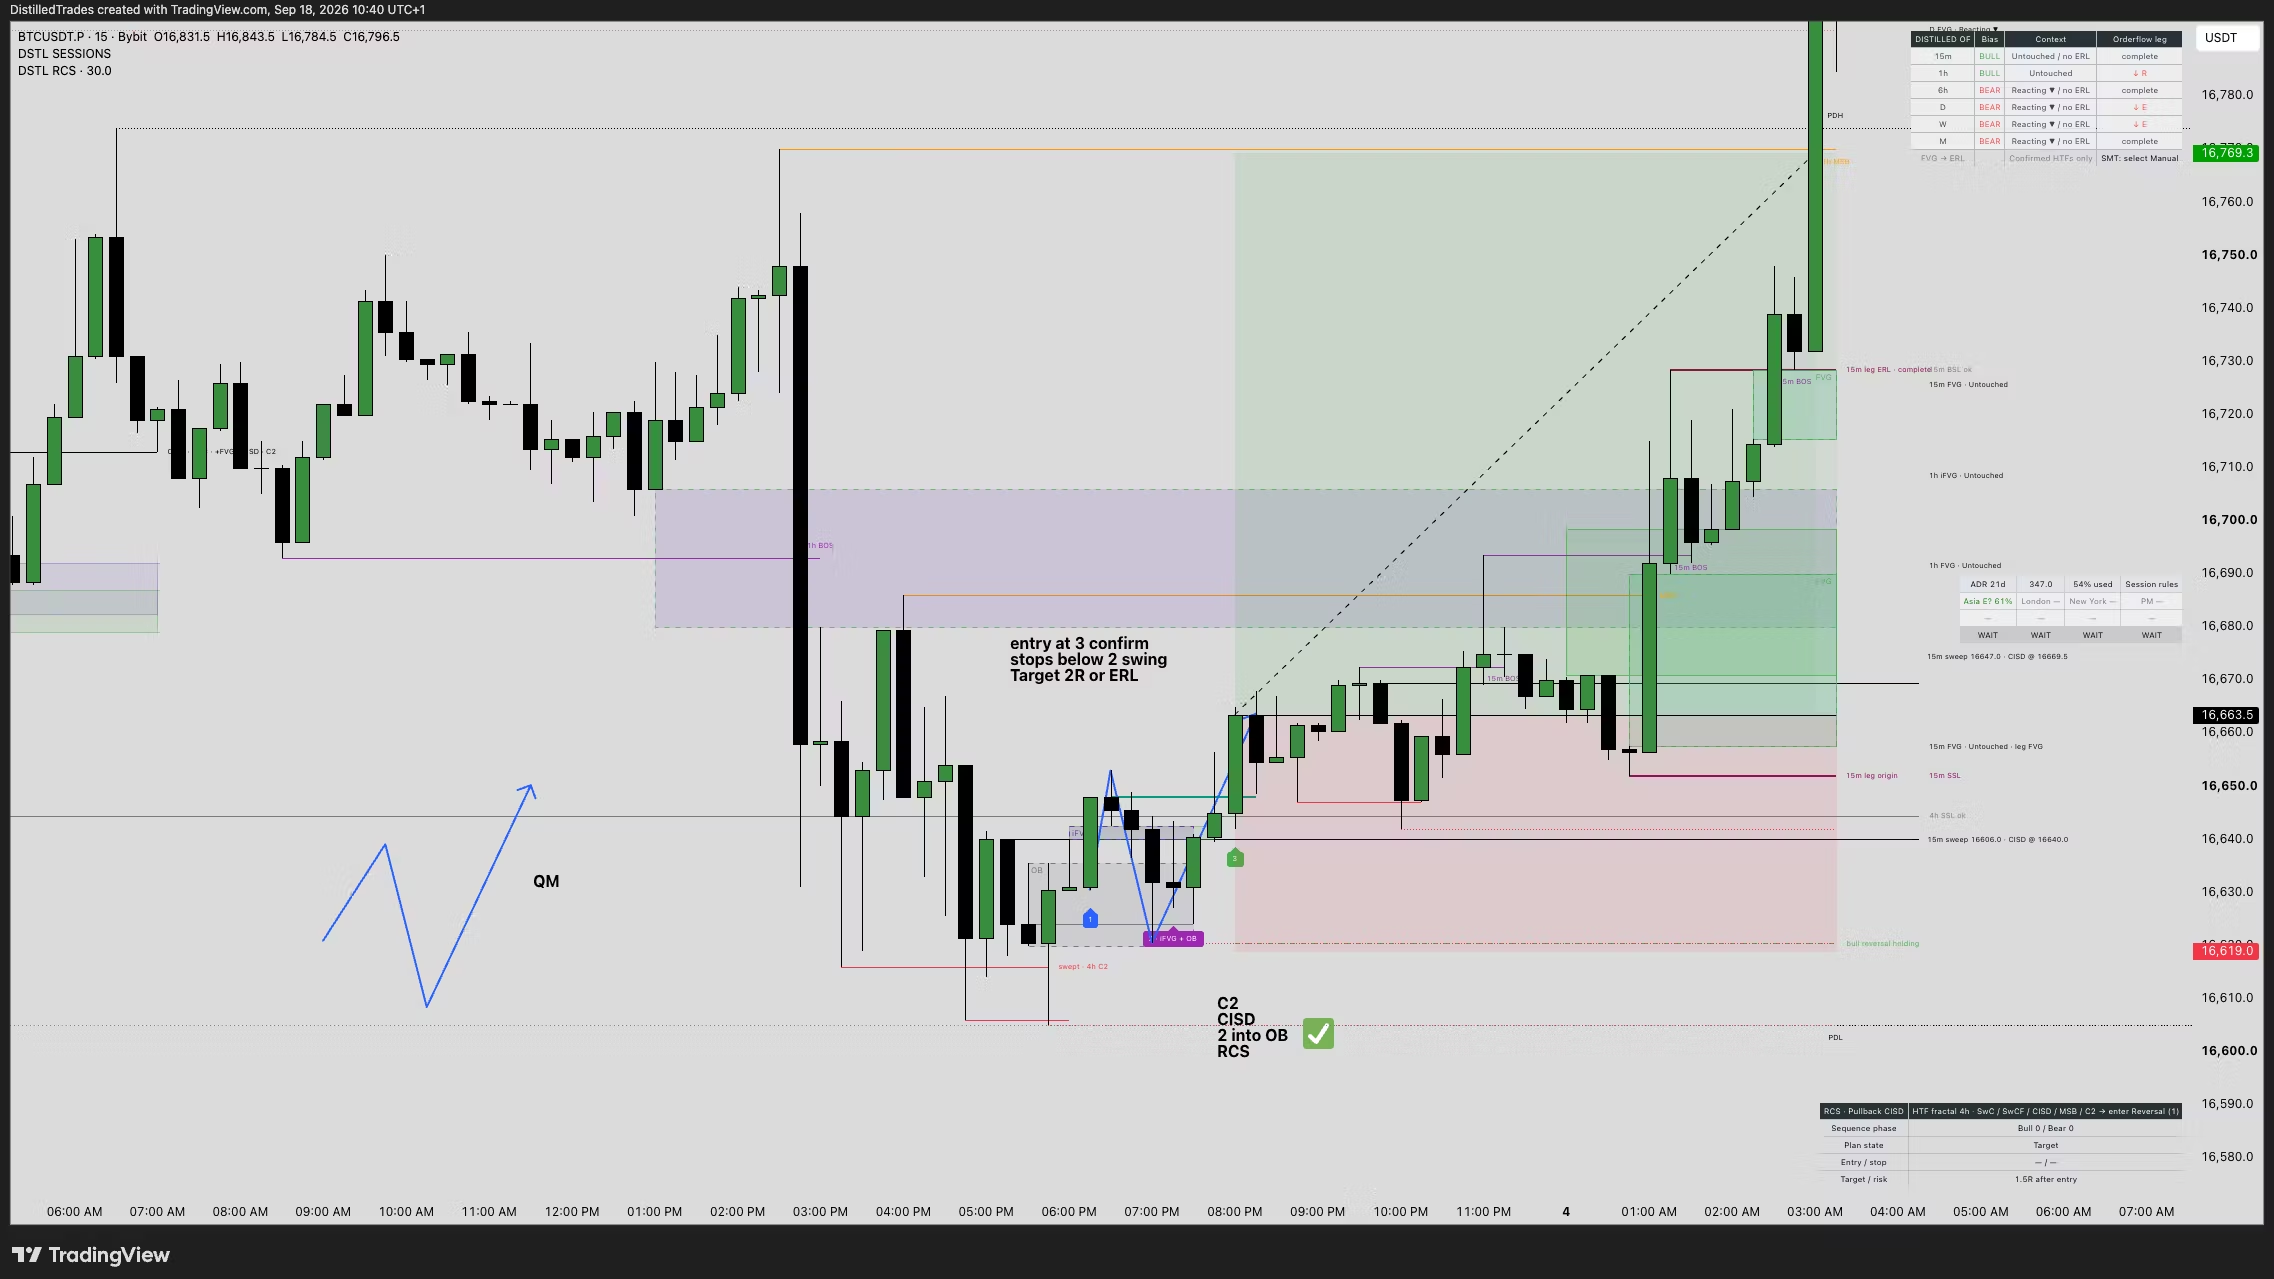
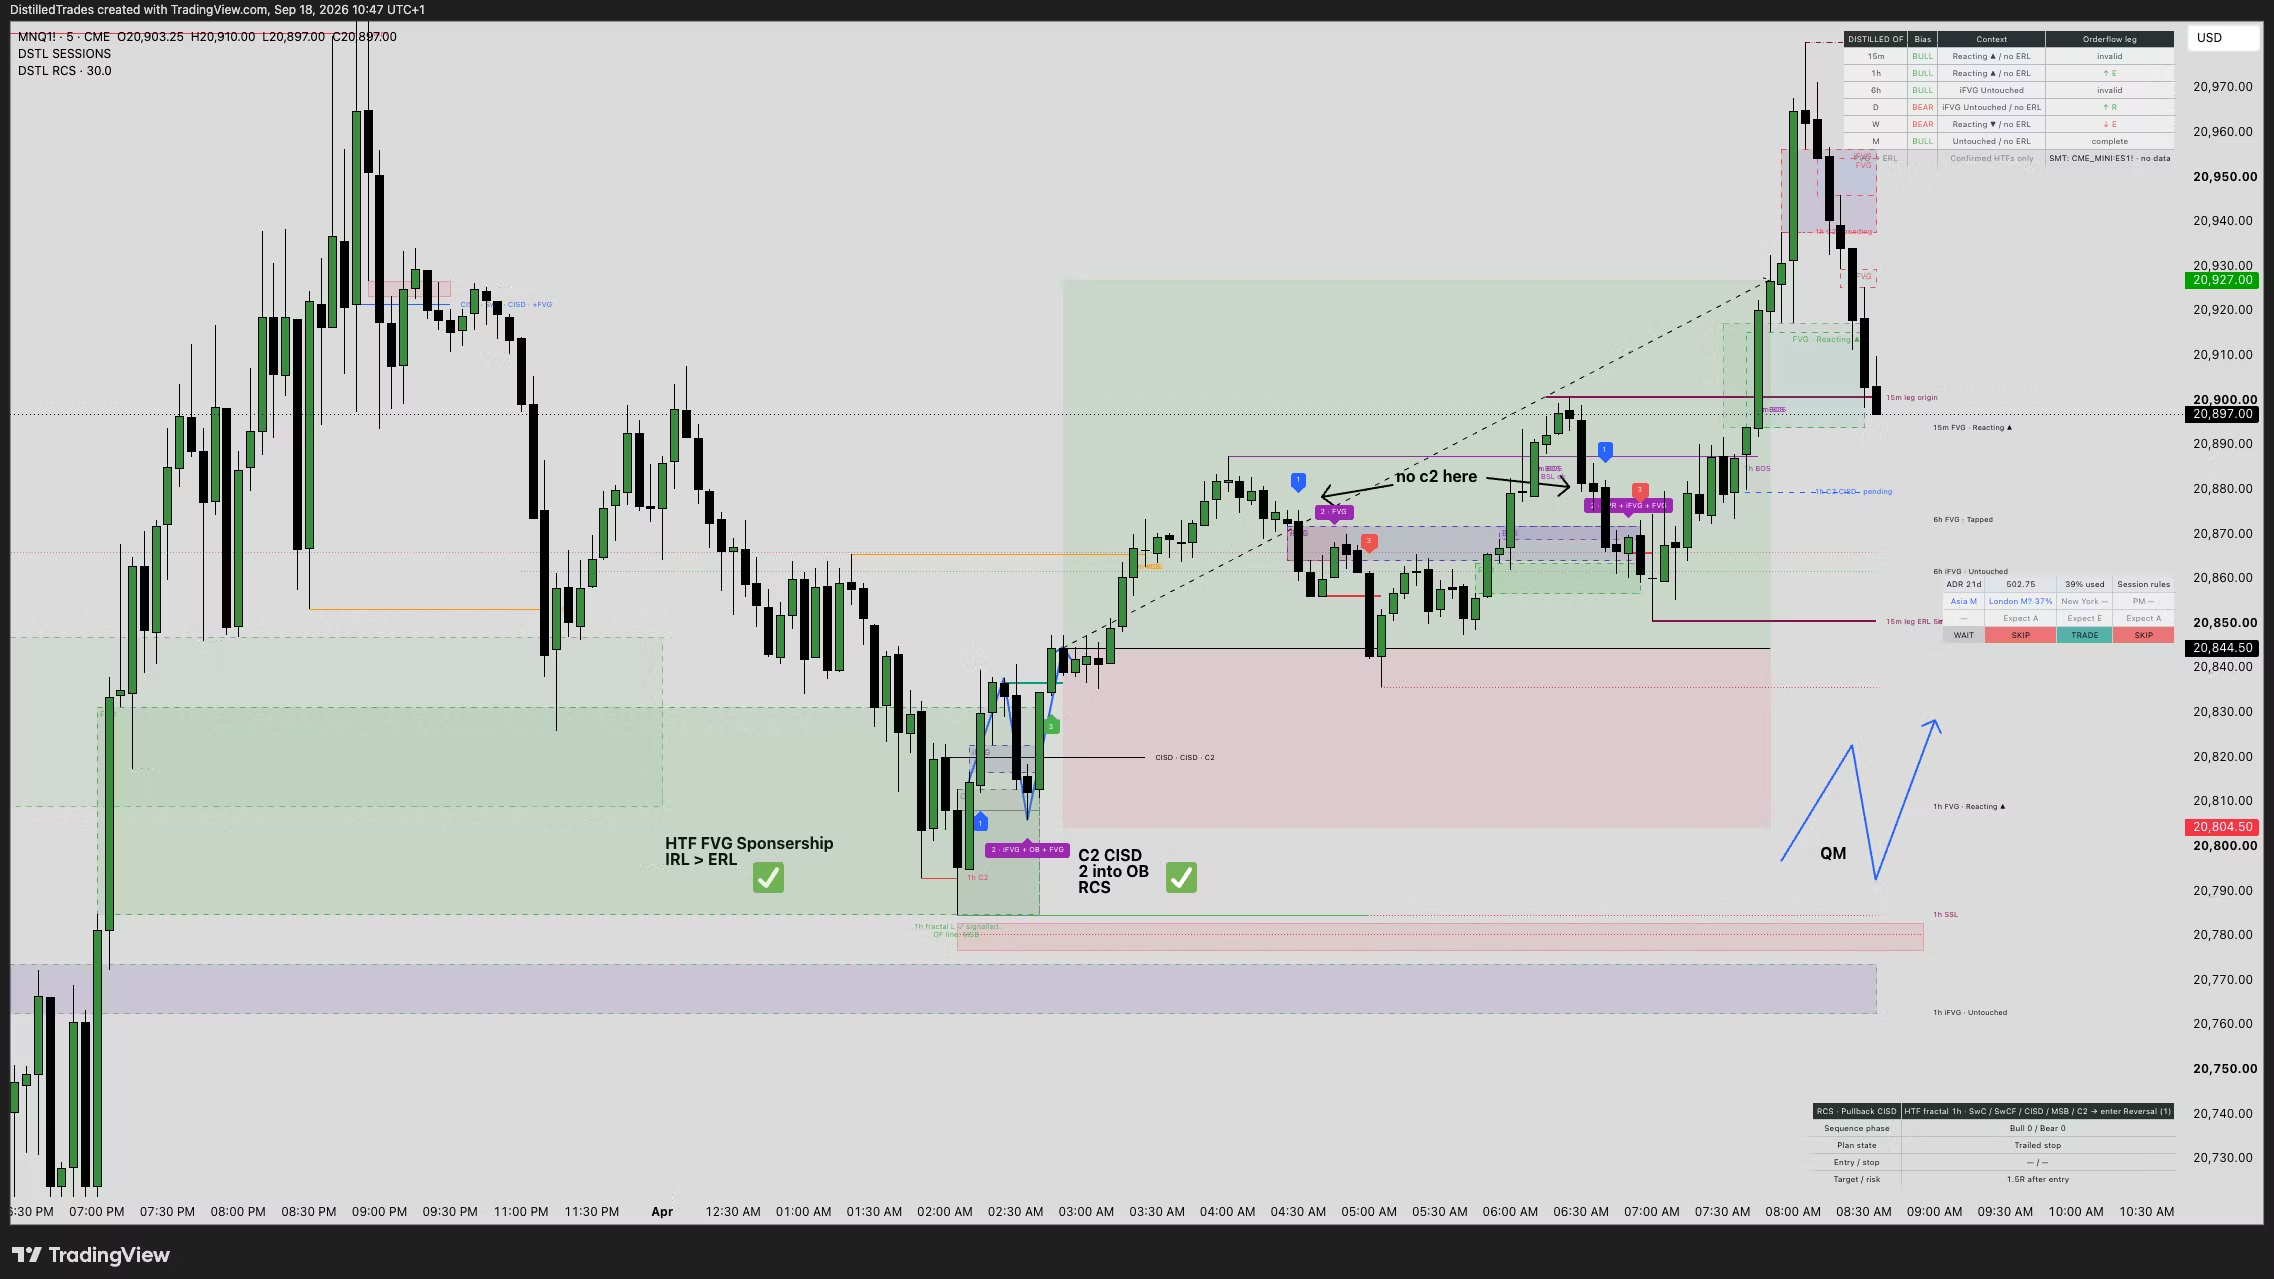
One read, every timeframe. Each timeframe is judged on its own candles, so a 6h zone is read on 6h candles whether you're on a 1 minute chart or a daily one. Bias, nearest zone, and whether that leg is expanding or retracing — one panel.
Zones with a life, not a box. Gaps are drawn from the candle that opened them and followed through: untouched, tapped, reacting, failed, inverted when price closes through. A level that changes sides stays on the chart as an iFVG.
Orderflow you can see. A leg is the current push — the swing it came from, the swing it's working toward, the gap between. The nearest higher timeframe's leg is drawn on your chart, and the gaps the live leg leaves on your own candles appear as they form.
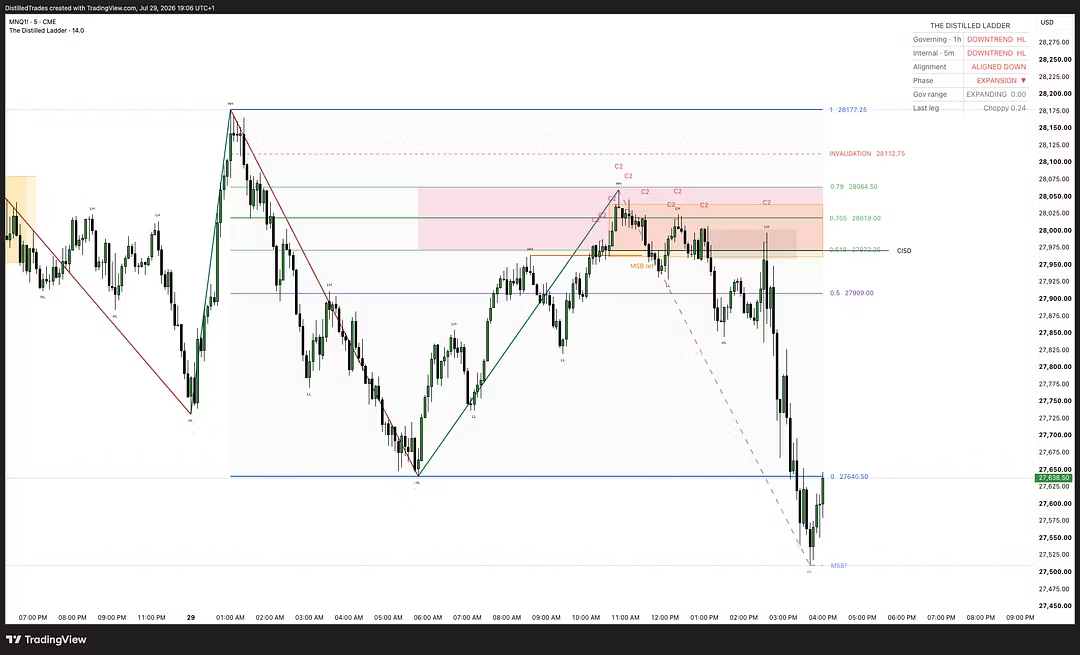
The sequence, numbered. A turn is numbered 1 · 2 · 3 on the candles that made it, the level that invalidates it is drawn, and the pullback is labelled with what it landed in — a gap, an inverted gap, an order block, a balanced price range.
Alignment with the sweep and the C2. When a higher-timeframe fractal is swept, the level taken is marked, and the C2 and its CISD show as pending while that candle is open and freeze when a close confirms. Underneath, your chart numbers the same turn — when they line up, you see it.
Plus swept levels, structure breaks, previous day's high and low, untaken range edges, SMT. Every group can be switched off.
Analysis, not signals. It describes structure and claims no performance. Not financial advice.
- 2 months ago
I’ve been using this OTE indicator for my trading strategy, it fits my system perfectly. The developer responded very quickly to my feedback about signal lag, and a new update is coming to optimize the forming OTE display. Also the seller kindly extended my subscription for my duplicate payment wit...
- 2 months ago
- 2 months ago